

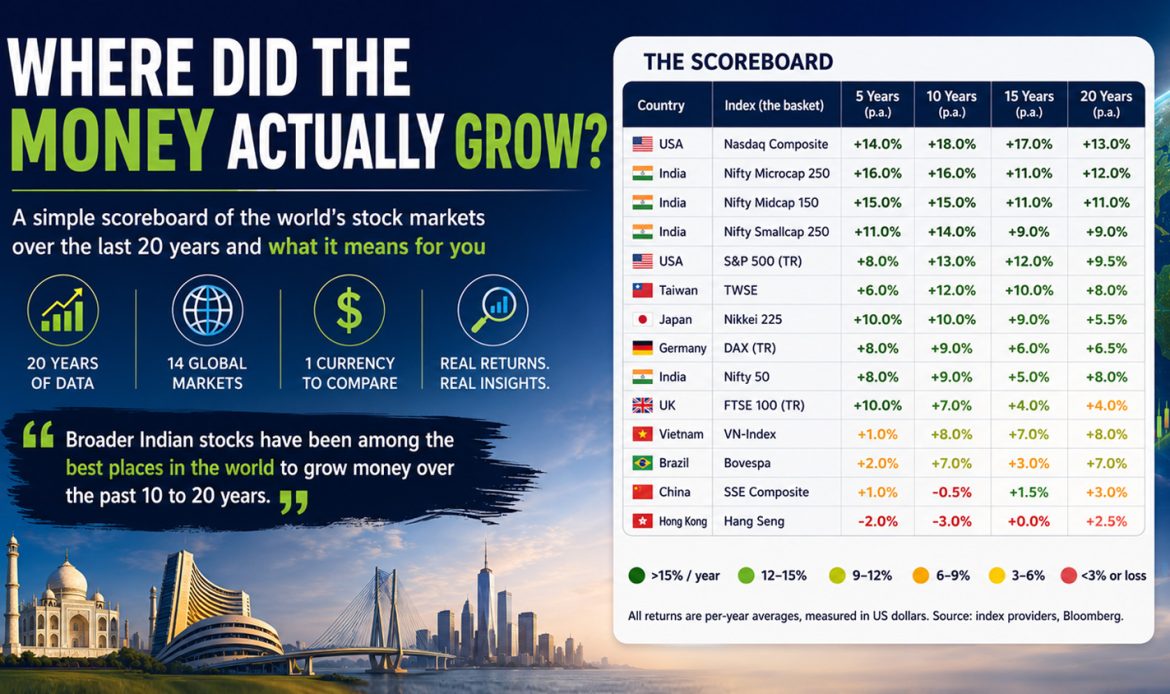
A simple scoreboard of the world’s stock markets over the last 20 years and what it means for you
Every few years, a new story tells us where to invest. Right now, it’s American technology. Before that, it was China. Before that, it was real estate. The problem with these stories is that they sound most convincing when the easy gains are already behind us, and they go quiet just when the next opportunity is quietly beginning.
So instead of following the latest story, let’s do something simpler. Let’s just look at the scoreboard. Over the last 5, 10, 15, and 20 years, where in the world did money actually grow?
The Scoreboard
| Country | Index (the basket) | 5 Years | 10 Years | 15 Years | 20 Years |
|---|---|---|---|---|---|
| USA | Nasdaq Composite | +14.0% | +18.0% | +17.0% | +13.0% |
| India | Nifty Microcap 250 | +16.0% | +16.0% | +11.0% | +12.0% |
| India | Nifty Midcap 150 | +15.0% | +15.0% | +11.0% | +11.0% |
| India | Nifty Smallcap 250 | +11.0% | +14.0% | +9.0% | +9.0% |
| USA | S&P 500 (TR) | +8.0% | +13.0% | +12.0% | +9.5% |
| Taiwan | TWSE | +6.0% | +12.0% | +10.0% | +8.0% |
| Japan | Nikkei 225 | +10.0% | +10.0% | +9.0% | +5.5% |
| Germany | DAX (TR) | +8.0% | +9.0% | +6.0% | +6.5% |
| India | Nifty 50 | +8.0% | +9.0% | +5.0% | +8.0% |
| UK | FTSE 100 (TR) | +10.0% | +7.0% | +4.0% | +4.0% |
| Vietnam | VN-Index | +1.0% | +8.0% | +7.0% | +8.0% |
| Brazil | Bovespa | +2.0% | +7.0% | +3.0% | +7.0% |
| China | SSE Composite | +1.0% | -0.5% | +1.5% | +3.0% |
| Hong Kong | Hang Seng | -2.0% | -3.0% | +0.0% | +2.5% |
All returns are per-year averages, measured in US dollars. Source: index providers, Bloomberg.
India’s quieter winners
Look at the top of the table. The very best performer over 10 years is Nasdaq, yes, but right alongside it sit three Indian market segments: small cap, midcap and microcap stocks.
Over five years, they’ve actually done better than US tech. Over 20 years, they’re still in the top group.
These aren’t names most people talk about at dinner parties. “Nifty Midcap 150” doesn’t have the glamour of “Apple” or “Google.” But these are baskets of medium-sized and small Indian companies, the kind that grow alongside India’s expanding economy, its rising middle class, and the slow shift from cash savings into financial products like mutual funds.
| Quietly, away from the headlines, broader Indian stocks have been one of the best places in the world to grow money over the past 10 to 20 years. |
Why most people miss this story about India
Over 15 years, the Nifty 50 grew at just 5% per year in dollar terms. Solid, but not spectacular. The Nifty Smallcap 250 grew at 14% per year over 10 years, the Nifty Midcap 150 grew at 15%. Same country. Same time period. Wildly different results.
The lesson is straightforward: in India, which slice of the market you own matters as much as the country itself. Owning only the biggest 50 companies misses where most of the growth has happened.
American tech has been remarkable but it’s one bet
The Nasdaq’s numbers are stunning. An 18% per-year return over 10 years, in dollars, is the kind of compounding that turns ₹10 lakhs into roughly ₹52 lakhs over a decade.
But it’s worth being honest about what this represents: a handful of US technology giants like Apple, Microsoft, Google, Amazon, Nvidia, and a few others that happened to dominate the most important shift of our generation. Treating this as the default place for all your money assumes the next 20 years will look exactly like the last 20. They usually don’t.
Some famous markets have quietly disappointed
Now look at the bottom of the table. China’s main stock market has actually lost money, in dollar terms, over the past 10 years. Hong Kong’s Hang Seng is in the red across every time period shown. The UK’s FTSE 100, one of the oldest and most respected indices in the world, has grown at just 4% per year over 20 years.
They’re widely held, widely discussed in business news, and many investors assume they’re solid choices. The numbers tell a different story. “Famous” and “profitable” are not the same thing.
The currency point most people skip
All the numbers in this table are in US dollars. This is crucial to understand that:
If a country’s stocks grew 12% per year in their local currency, but that currency weakened 6% per year against the dollar, your real return ie. what you could actually buy with the money was only about 6%. Currency quietly eats into returns, especially in emerging markets. The dollar lens strips this out and shows what really happened to your purchasing power.
This is particularly important if you live abroad, send money home, or plan to spend or travel internationally. Local-currency returns can mislead. Dollar returns don’t.
What does this mean for you?
None of this is a guarantee about the future. Past performance never is, and any honest advisor will tell you so. But the scoreboard does give us a useful starting point: a record of what actually happened, not what people predicted would happen. A few practical thoughts:
- If you have money in Indian stocks, check whether you own only the largest companies or a broader mix. Adding mid-sized and smaller Indian companies has historically been where much of the growth happened.
- US technology has been an incredible run, but don’t mistake one extraordinary period for a permanent rule. The market that led the last decade rarely leads the next one.
- Be careful with markets that have a good story but a poor track record. China and Hong Kong have looked tempting many times in the past 15 years. The numbers suggest patience was rarely rewarded.
- Pay attention to currency. When you read about a foreign market’s returns, ask whether they’re in local currency or in dollars. The two can be very different.
The bottom line
Twenty years of data. Fourteen of the world’s biggest stock markets. One simple currency to compare them all. The picture that emerges is unfashionable but clear:
Broader Indian stocks, not just the famous Nifty 50, but the wider market including midcaps and smaller companies have been among the best places in the world to grow money over the past two decades. American technology has been the other great story, but it’s one country and one theme not a substitute for owning a thoughtful mix.
The next 20 years won’t be a copy of the last. But if you’ve been told that the only “safe” places for serious money are the US and your fixed deposit, it may be worth taking another look at the scoreboard. The evidence is sitting right there in green.
Disclaimer
This article is for informational purposes only and does not constitute investment advice, an offer, or a solicitation. Past performance is not indicative of future results. The returns shown are compiled from publicly available index data and adjusted to US dollars; minor differences with other published sources may arise from differences in start dates, dividend treatment, and currency conventions. Investments in mutual funds and securities are subject to market risks. Investors should read all scheme-related documents carefully and consult their financial advisor before investing.
Orbit by Urjita Financial Services Pvt. Ltd. | AMFI Registered Mutual Fund Distributor | Mumbai, India